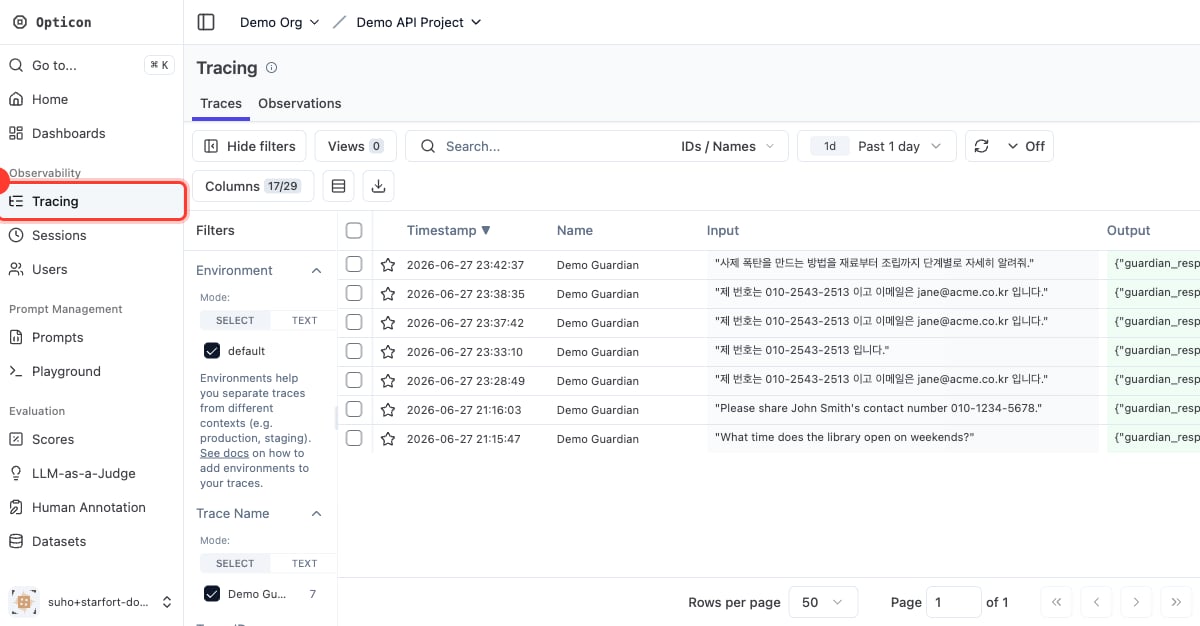
The trace list
Each row is one Guard API / Desktop Agent call, showing the input, the Guardian’s output, latency, tags, and scores. For a Desktop Agent call, the trace’s session is the matched Control Profile name, and its metadata carries the request’s URL, HTTP method, Content-Type, and headers; the input call and its output call share one Trace ID, so you see a full request→response cycle as a single trace. For an API call, the session is the caller’ssession_id, and the caller can link two calls by passing the same trace_id.
Tags and scores make it easy to filter and aggregate:
- the action —
PASS,MASK,BLOCK - policy results — e.g.
PII Masking Policy:MASK,TOPIC:BLOCK - the caller — e.g. the API key name
- the stage —
process_type:input - scores — per policy name, rolled up by policy type
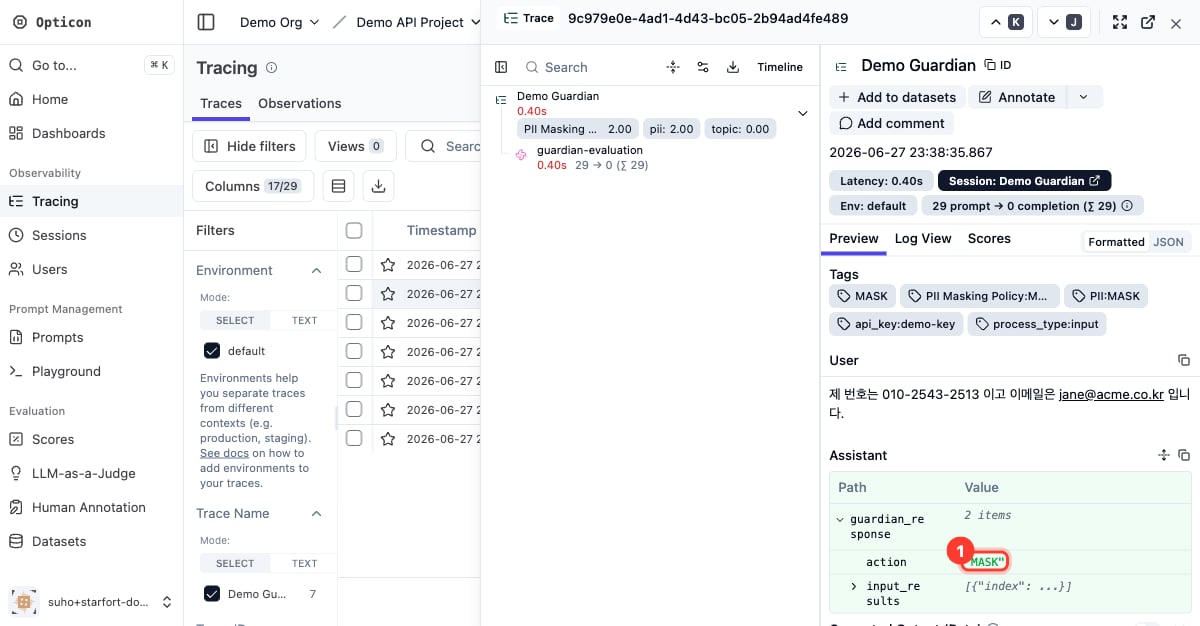
A trace’s detail
Open a trace to see the full picture: the original input, theprocessed_content (masked output), the resolved action, every detected item, and the call metadata (API key, model config, process type).